-
Get BOB
Magnetometer Survey Planning, Data Acquisition & Visualization Software For Windows (64 bit)
Get the latest BOB version and sample surveys. -
Latest BOB Features
Added Survey Type: AUV + Explorer
Import and process mag data from AUV surveys.
Enhanced Survey Planning
Create, save, and import Guide Grids for future survey planning.
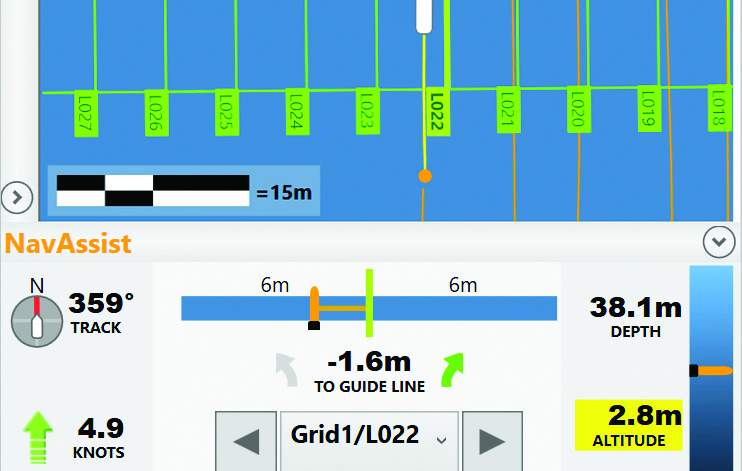
NavAssist
Take the pain out of planning surveys and accurately piloting your vessel with BOB’s Guide Grid tool and Navigation Assistance.
-
New: Analytic Signal Maps!
 BOB Analysis Module (BAM) puts the ability to make Analytic Signal Maps quickly and intuitively in the hands of experts and amateurs alike.
 -
Intuitive Assisted Setup
Connect your computer, mag, and GNSS through COM or USB Port guided by BOB’s simple Setup Assistant.
-
Mag Monitoring and Control
BOB monitors your connection and mag status, alerting you to signal strength, sample rate, synch, depth, altitude (above the seabed). Detailed diagnostic panels and terminal access facilitate troubleshooting & issue resolution.
-
(Fully) Review Plot in Time and Space
Magnetic field data rescales based on your level of magnification.
The interactive Survey Overview gives you instant access to any part of your survey.
-
Live Layback Correction
BOB calculates mag Layback in real-time to pin-point the mag’s position even when making turns. -
Data Portability
BOB’s (robust, stable, secure & flexible) MS SQL database technology lets you:
- Store and move between multiple surveys naturally.
- Say goodbye to loose files. BOB automatically packs survey settings, setup parameters, and collected data.
- Annotate, export, archive and restore files.
-
Call Us
To discuss whether BOB is the perfect fit for your application, please contact Gina Lopez: gina.lopez@marinemagnetics.com +1 (619) 655-0179
Workflow
-
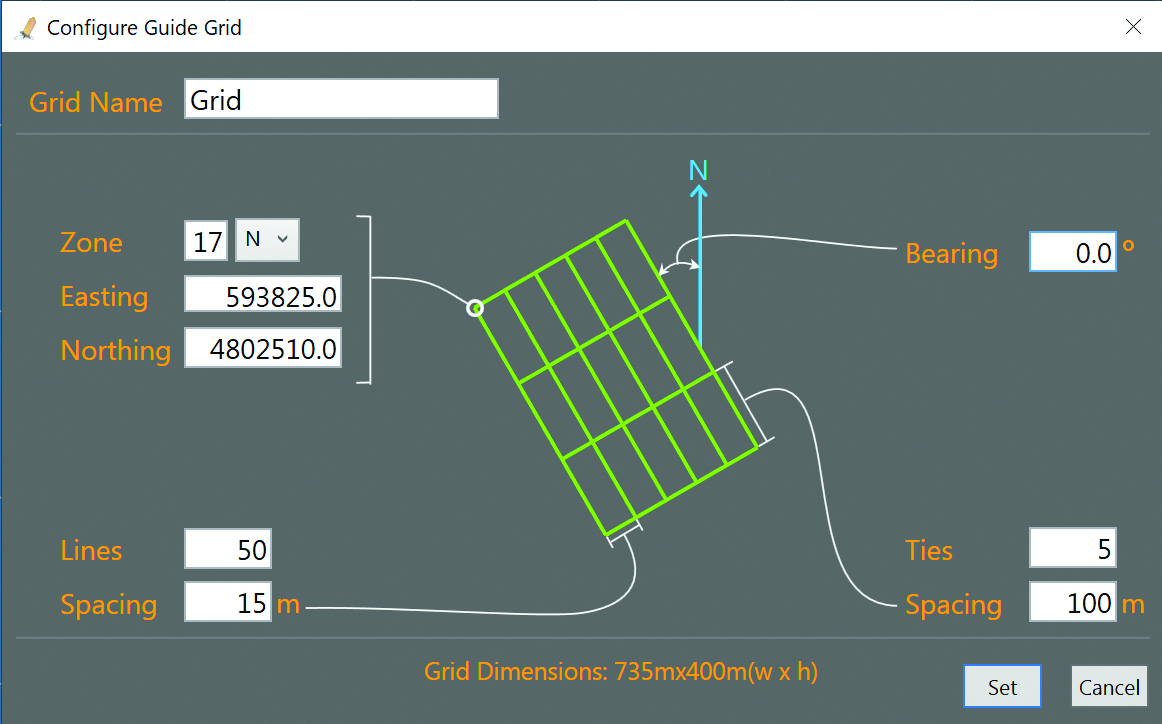

Specify Survey Parameters
Specify area and Guide Lines by defining the location of your Grid, number of Survey Lines, line spacing, cross/tie lines (if needed), angle/bearing of the lines, if not North-South. The result: a Grid of green Guide Lines NavAssist uses to guide the boat operator during the survey.
-
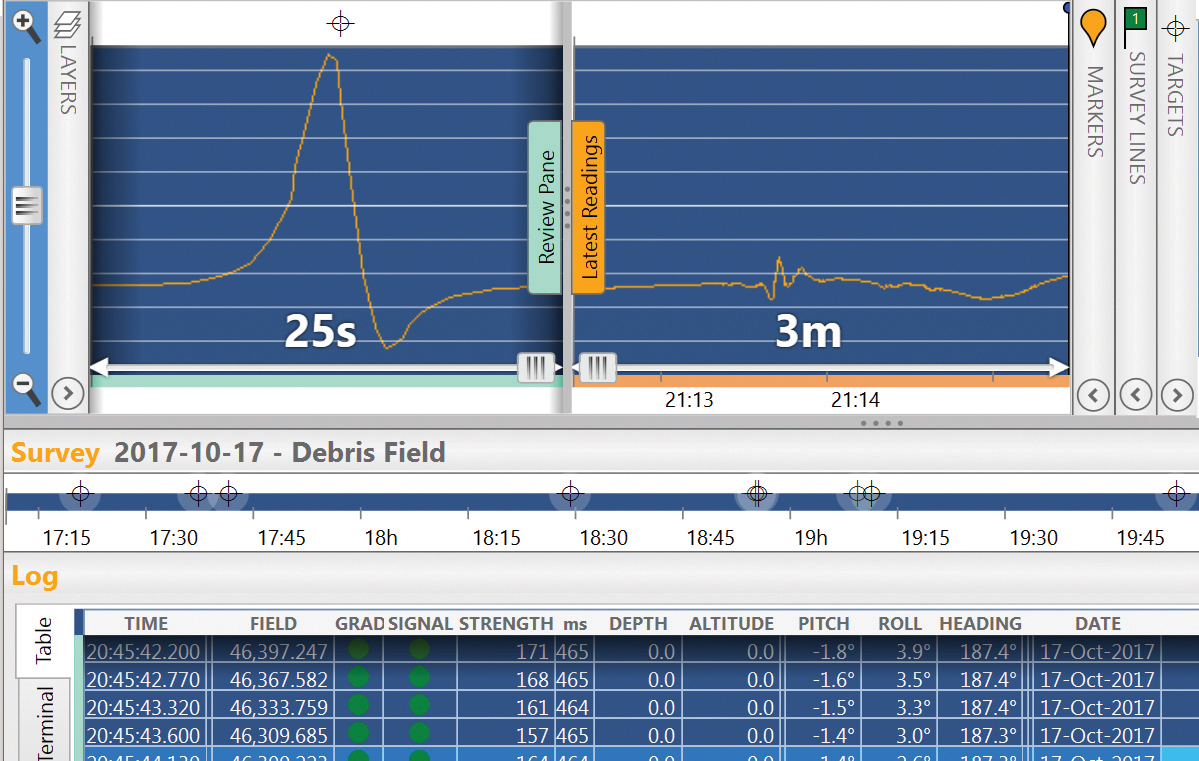
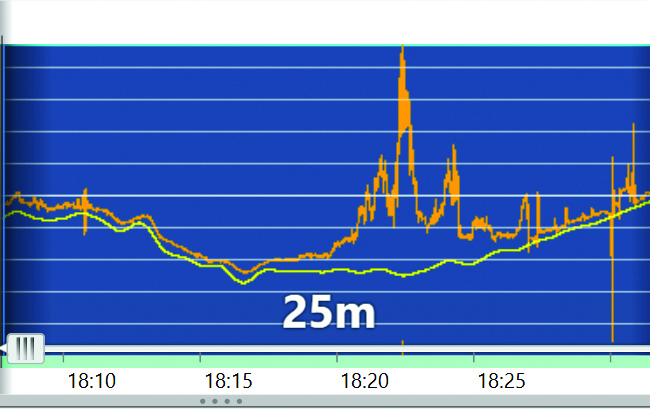
Plot, Record and View Data
Sensor readings plot as you survey. Scale X and Y axes to find the patterns. Shift individual traces up and down for comparison. Move the cursor in the Plot to see readings highlighted in the Log Table below. Terminal Tab: See and send raw communication directly to the mag (if you know the codes). Layers Panel: Select which sensor’s data to display. Review Pane: Drag the Review/Real-Time Splitter Bar to inspect data collected earlier while monitoring real-time data.
-
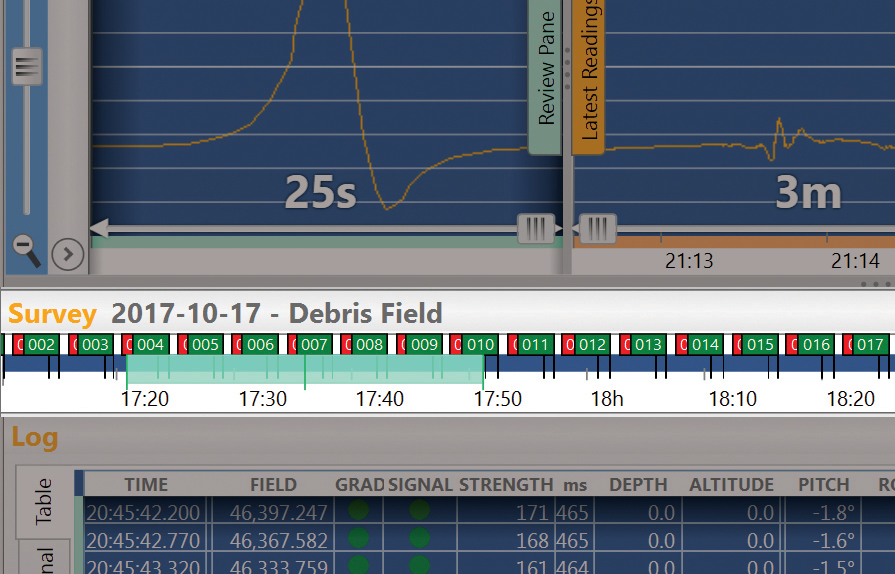
Zoom and Scroll Through the Survey Timeline
Navigate easily; the Survey Timeline lets you know what part of the survey you’re viewing at-a-glance.
-
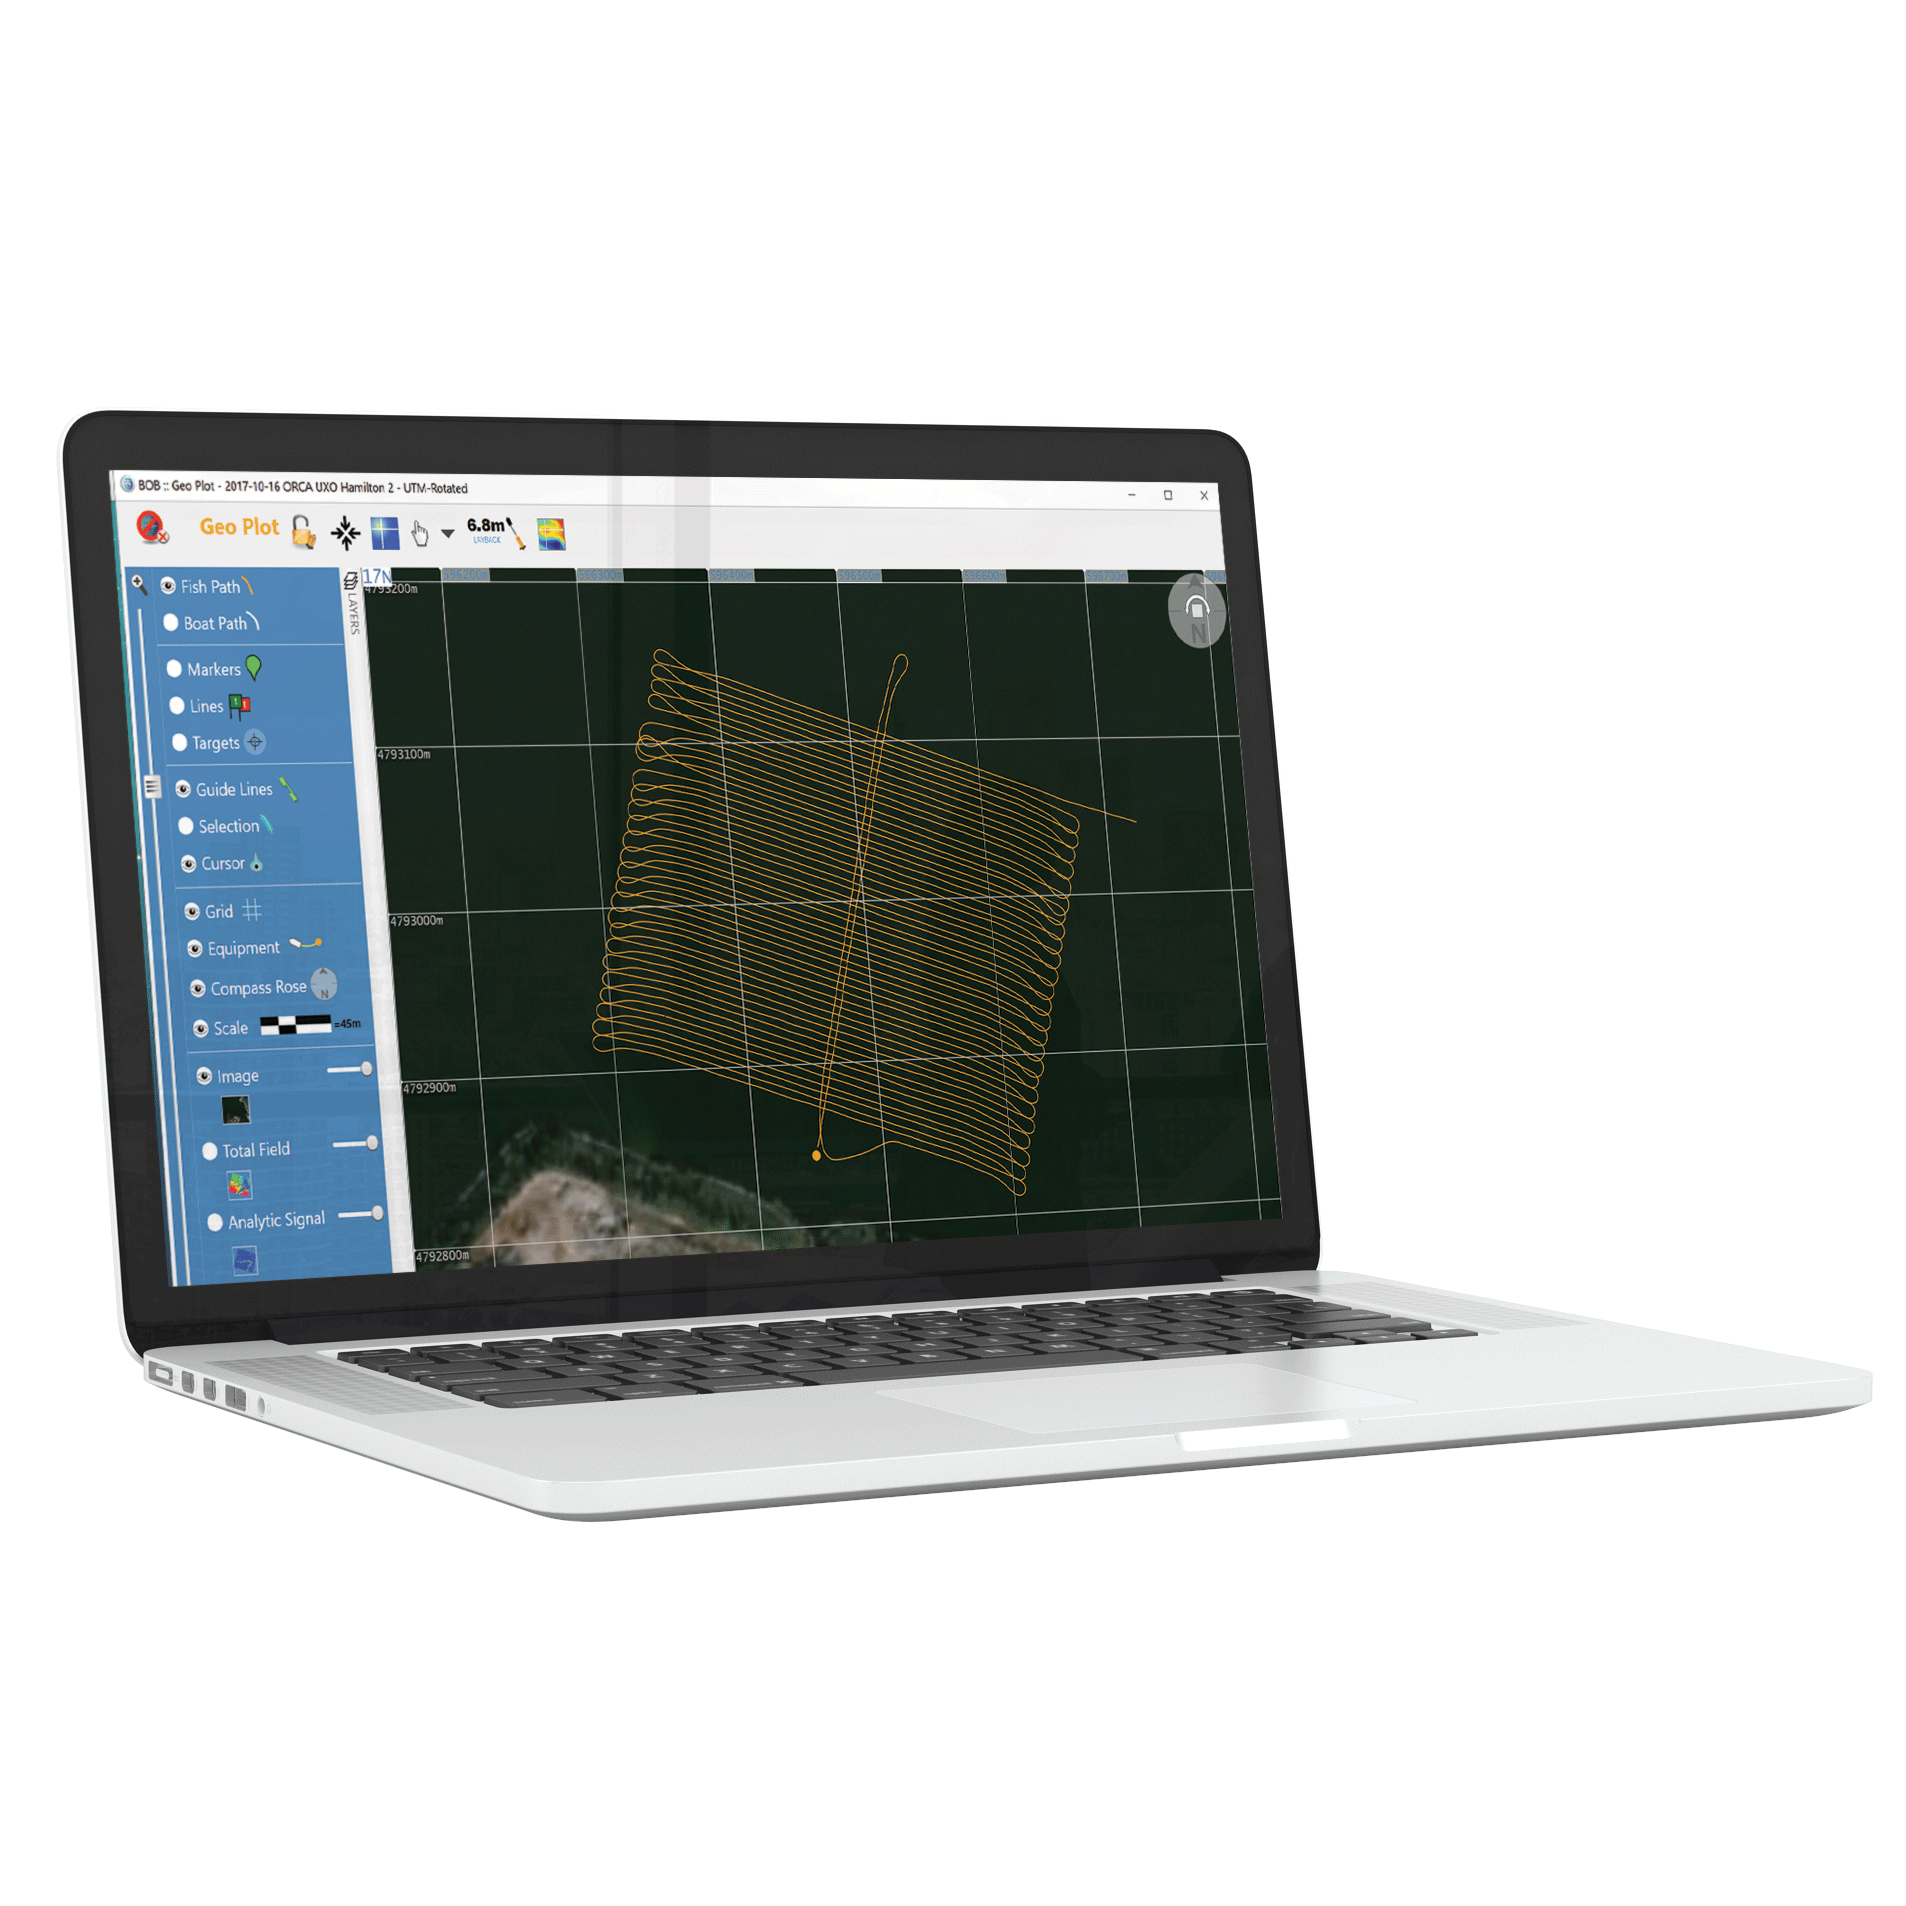
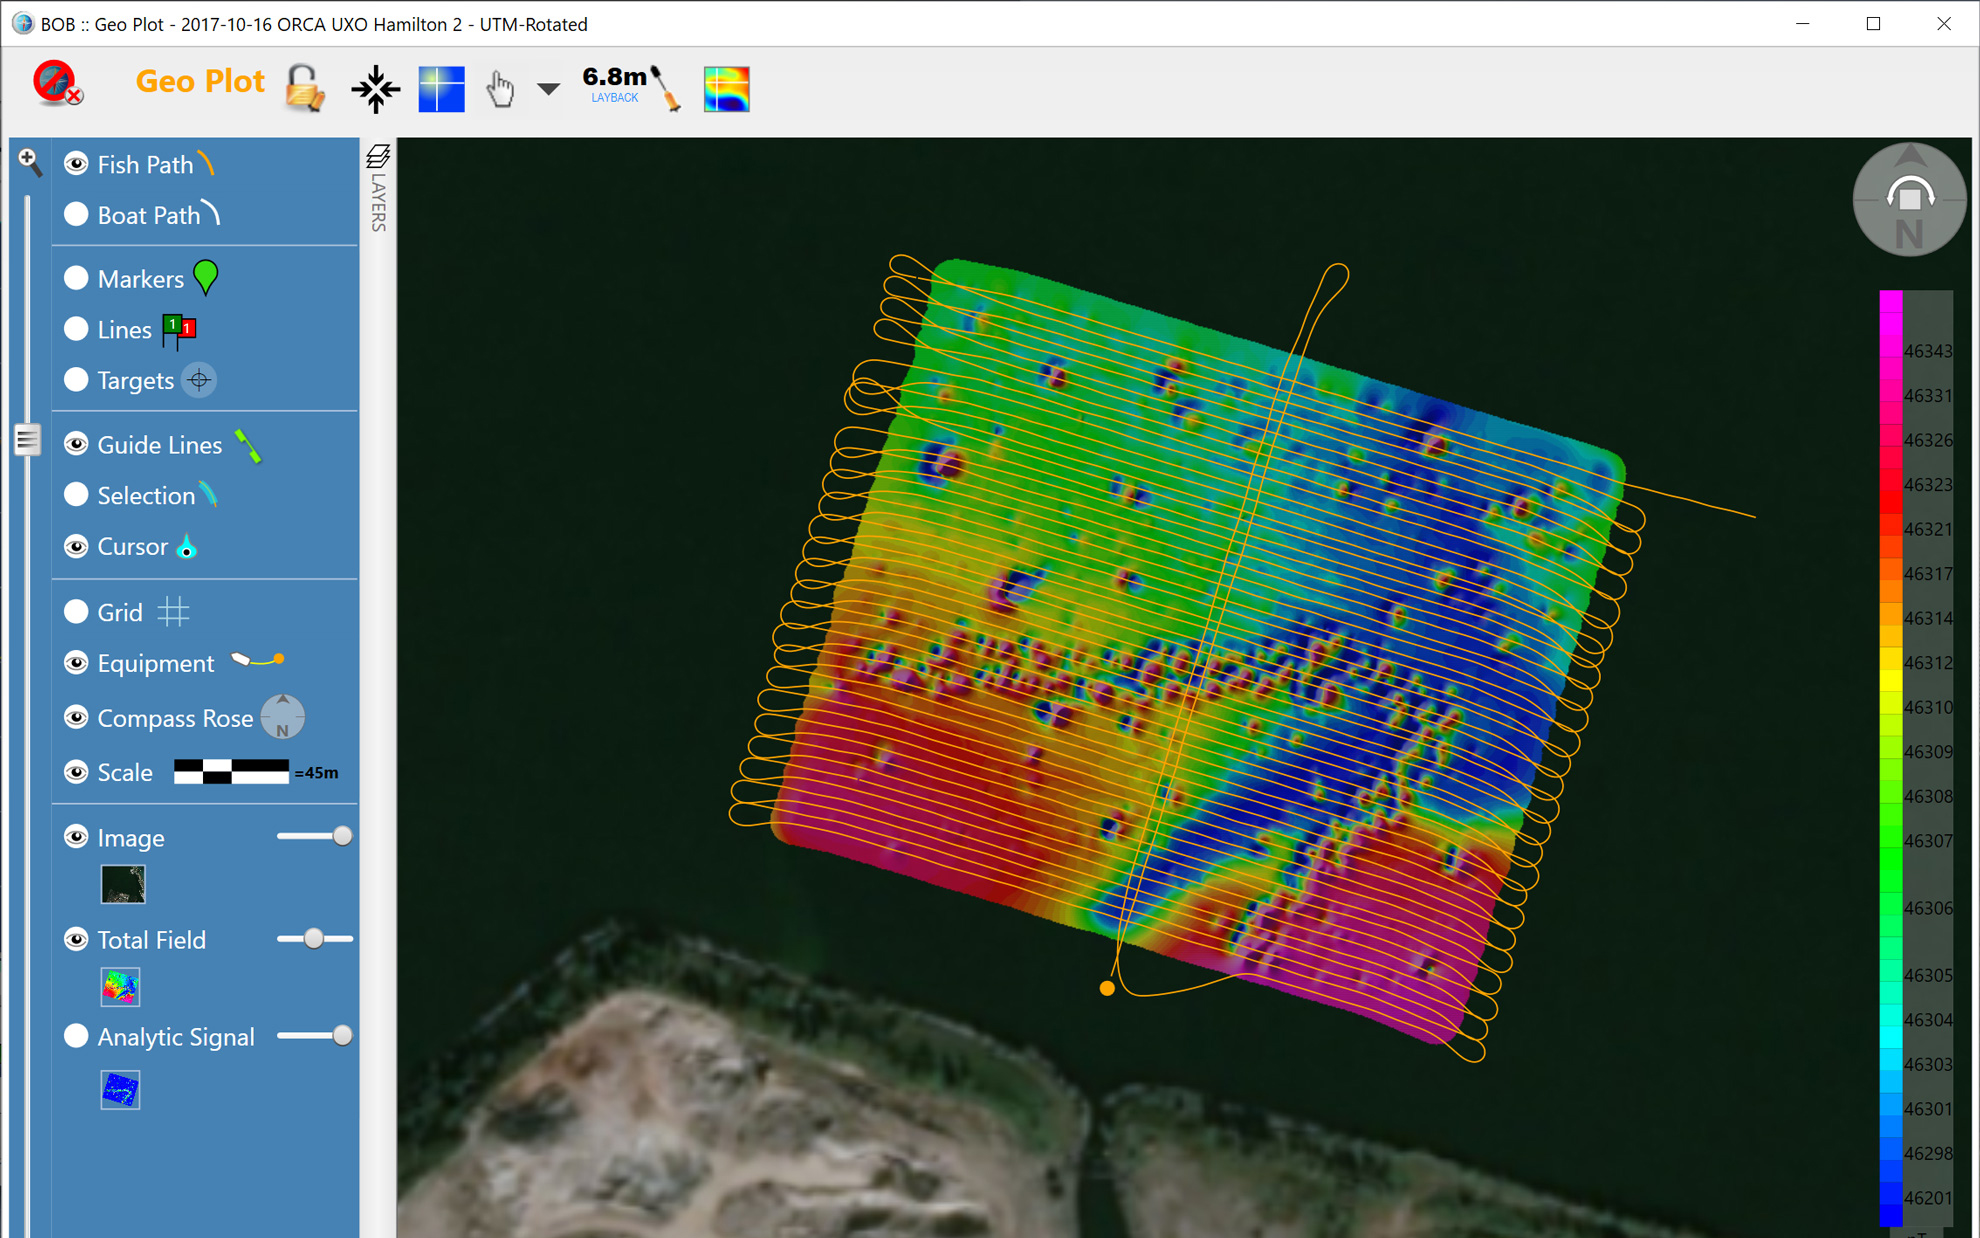
Geo Plot
The Geographic Plot shows paths of the GNSS/vessel and the towfish on a coordinate grid, as Latitude/Longitude format or in UTM projection with WGS84 datum. See the precise location of your readings, Markers and Survey Lines. Click on the mag’s path to see the data at that location. See and edit Markers & Survey Lines directly on the map. Set background chart or map by importing geo-referenced images in GeoTiff format. 10Hz GNSS support provides unprecedented accuracy. BOB automatically interpolates between GNSS and mag sampling rates and tags readings with geographic coordinates. See NMEA GNSS information on-screen in real-time. This data is stored independently from the magnetometer data stream. BOB’s NavAssist feature presents useful survey parameters to the vessel navigator during the survey in a panel on the Geo Plot window, including: Distance from the current Guide Line Vessel bearing and speed Magnetometer depth and altitude in the water column
-
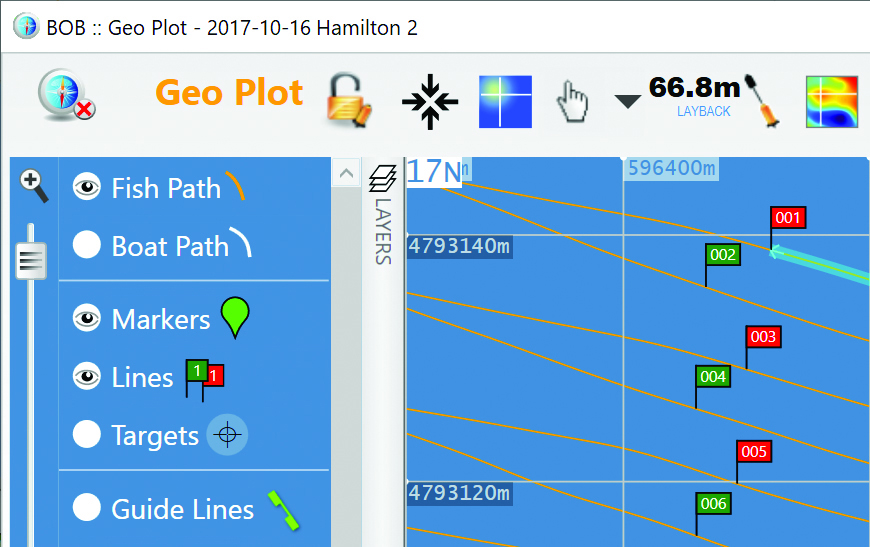
Create and Edit Survey Lines
Mark your Survey Lines on the Geo Plot on-the-fly by dragging your mouse. Fine-tune the location of the Flags any time. Select a line to see the Plot one line at a time. Plan your survey by placing single Guide Lines or a Grid that includes ties spaced at regular intervals.
-
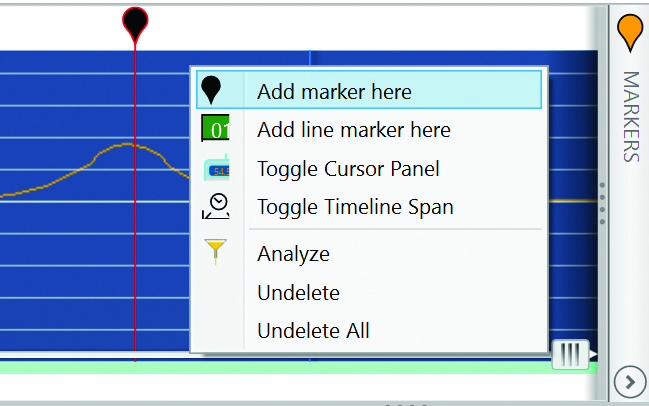
Create and Edit Markers
Place Markers on Profile Plot or Geo Plot in real-time as a way of keeping notes or marking promising anomalies. Color-code and group marked features. Place and move Markers any time. Place Markers automatically if your GNSS emits NMEA GPEVT sentences. Click on a Marker in the Geo Plot to jump to its information in the Profile Plot.
-
Base Station Correction
Import data from the Sentinel Base Station or IAGA compatible data from magnetic observatories (e.g., Intermagnet.org). BOB automatically calculates the corrected data set. Review the Log Table or the Profile Plot. BOB automatically calculates the corrected data, which you can review in Profile Plot or Log Table. Delete regions or individual readings safely. BOB preserves your original survey data. You can always start over without the fear of data loss or corruption.
-
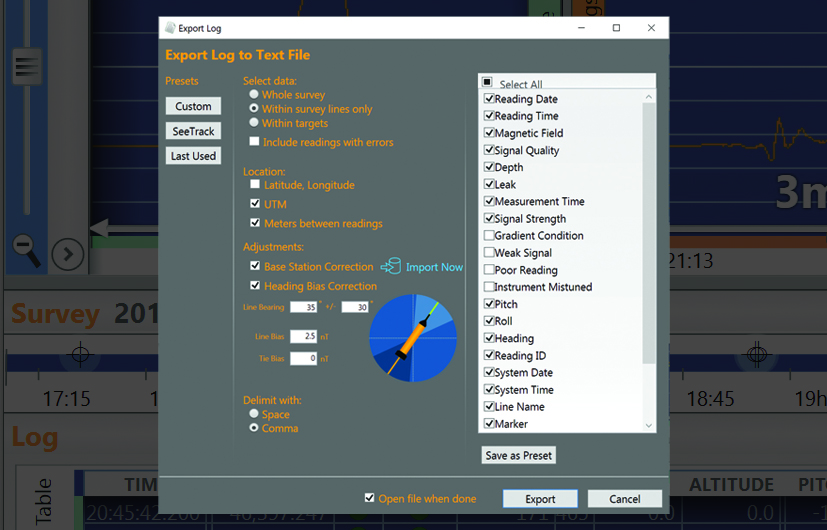
Flexible .csv Exports
Export your entire data set or just the lines you select to text files for other GIS systems. Save your favourite settings or use the SeeTrack predefined settings.
-
Plan, collect, and clean your survey data with BOB. Pinpoint with BAM.
The new BAM add-on puts the ability to make Analytic Signal Maps quickly and intuitively in the hands of experts and amateurs alike. Targets: Activating BAM lets you mark targets on the map or the Profile Plot, label them, and see statistics to refine your analysis. Export maps as GeoTIFF. Grids can be exported numerically as Grid Exchange Format (GXF). Dive confidently armed with a list of location targets and sizes.