
Marine Magnetic Survey of a Submerged Roman Harbour, Caesarea Maritima, Israel
Published in: The International Journal of Nautical Archaeology (2004) 33.1: 122–136 doi: 10.1111/j.1095-9270.2004.010.x
Joseph I. Boyce and Eduard G. Reinhardt. School of Geography and Geology, McMaster University, Hamilton, Ontario, Canada L8S 4K1 Avner Raban Recanati Institute for Maritime Studies, University of Haifa, Mount Carmel, Haifa, 31905 Israel Matthew R.
Avner Raban. Recanati Institute for Maritime Studies, University of Haifa, Mount Carmel, Haifa, 31905 Israel Matthew R.
Matthew R. Pozza. Marine Magnetics Corporation, Richmond Hill, Ontario, Canada
A marine geophysical survey was conducted at Caesarea Maritima, Israel, to map the buried structure of King Herod’s Roman harbour. Magnetic surveys reveal the presence of an extensive hydraulic concrete foundation below the ruined harbour moles. The magnetic anomaly patterns indicate that the concrete foundation was laid out in header fashion along N-S and W-E trending segments to form two large ‘artificial islands’. Magnetic lows within the structure identify baffles that were infilled with sand to stabilise the concrete foundation walls.
Key words: magnetic survey, hydraulic concrete, Roman harbour, Caesarea Maritima.
In 21 BC King Herod commissioned the construction of a large, all-weather harbour at Caesarea Maritima, which he named Sebastos in honour of Augustus Caesar (Fig. 1A). The harbour took more than five years to construct and when completed was the largest artificial harbour of its time in the Mediterranean (Raban, 1992). Underwater excavations conducted at Sebastos during the last two decades have revealed considerable information about Roman harbour engineering and technology (Holfelder, 1988; Oleson, 1988; Hillard, 1989; Raban, 1992; Holfelder, 1997; Holfelder, 1999).
What set Sebastos apart from most other Roman harbours of its time was the innovative use of hydraulic concrete (a mixture of lime, volcanic ash and aggregate) to construct an extensive breakwater barrier and foundation for the harbour moles (Fig. 2). The addition of volcanic ash (pozzolana) served to increase the strength of the concrete and allowed it to set while in contact with sea water. Hydraulic concrete had been employed in the construction of Roman harbours as early as the 2nd century BC (its use was described by Vitruvius) but Sebastos is the first known use on such an extensive scale (Oleson, 1988; Raban, 1992; Raban, in press). Recent excavations have revealed that parts of the concrete foundations were emplaced as single large blocks (>390 m3 ), each weighing more than 680 tonnes (Raban, in press).
The importance of hydraulic concrete at Sebastos is now well established, but the extent and detailed layout of the harbour foundations are difficult to reconstruct. The foundations are exposed at several locations on the mole perimeter (Fig. 1), but over most of the harbour area are buried by up to 2 m of coastal sediments and a thick rubble layer. This layer consists of collapsed building stones, including massive sandstone ashlars that pose a major obstacle for underwater excavations. In addition, current erosion and bioencrustation have obscured the structural remains. Many attempts to map accurately the submerged remains have failed due to the complexity of the rubble mass.
In 2001 a pilot project was conducted to evaluate the use of magnetic methods for mapping the layout of the buried harbour at Sebastos. A primary objective was to map the configuration of the buried concrete foundation work. It was reasoned that the high content of volcanic ash and tuff within the hydraulic concrete (materials rich in magnetic oxides) should provide a sufficient magnetic contrast with the surrounding sediments to allow detection and mapping with a marine magnetic survey.
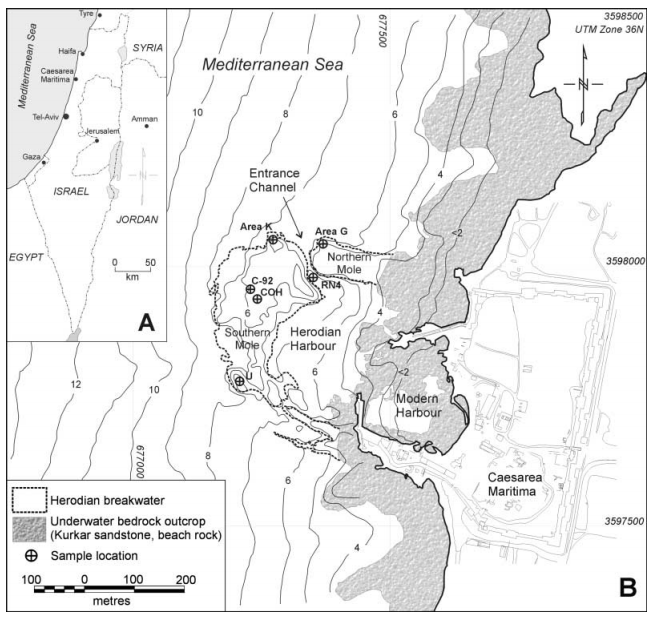
Figure 1. A. Location of study area. B. Map of Sebastos showing location of submerged Herodian breakwaters and generalised bathymetric contours (1 m interval). Core sampling sites and locations of excavations also shown.
In this paper we report on the results of magnetic property analysis of hydraulic concrete samples and marine geophysical survey work at Sebastos. This work demonstrates the utility of magnetic methods for mapping buried harbour structures and provides important new insights into the layout and method of construction of Herod’s harbour. Hydraulic concrete was used widely in the construction of other Roman ports (e.g. Portus, Antium; Brandon, 1996; Hohlfelder, 1997) and the methods reported here have a broader application to the investigation of other ancient harbour sites.
Study area and physical setting
Sebastos is located on the Mediterranean coast of Israel, about 40 km south of the port city of Haifa (Fig. 1A). Most of the harbour ruins lie submerged at a depth of 4–10 m below present sea level and cover an area of about 10 ha. The harbour and the adjacent ancient port city of Caesarea Maritima (Fig. 1B) are situated on a broad coastal plain that extends the length of the southern Levantine coastline. The geology of the coastal plain consists of recent coastal sediments resting on Pleistocene sandstone bedrock (Fig. 1B). This bedrock, known locally as ‘kurkar’, is a calcareous-cemented eolianite and is interbedded locally with thin iron-rich paleosols layers termed ‘hamra’. The kurkar bedrock is exposed in coastal outcrops and in north-south oriented linear ridges and terraces in the offshore area (Avnimelech, 1962; Mart and Perecman, 1996). The stratigraphy of the harbour basin consists of littoral sands, silts and muds up to several metres thick with local concentrations of pottery sherds, building stones and other detritus (Reinhardt and Raban, in press).

Figure 2. Plan view layout of Herod’s harbour based on underwater archaeological evidence (from Reinhardt and Raban, in press).
Harbour layout and construction
Fig. 2 shows a reconstruction of Herod’s harbour based on underwater excavations and historical descriptions of Sebastos (Reinhardt and Raban, in press; Raban, in press). The original harbour included three sub-basins and was enclosed by a broad mole in the west (‘southern mole’) and a narrower, rectangular-shaped mole to the north (‘northern mole’) (Fig. 2). Access to the harbour was via a narrow funnel-shaped channel in the north-west. A secondary segmented breakwater, or procumatia, was installed on the seaward side of the southern mole. The breakwater barrier acted to absorb wave energy, preventing undermining of the mole and protecting the vaulted storage facilities on top of the mole from breaking waves. The harbour also featured a sophisticated flushing system consisting of sluice channels and gates constructed to maintain a constant inflow of sea water into the harbour and thereby preventing siltation of the harbour basins (Fig. 2) (Reinhardt and Raban, in press).
The method of construction of Sebastos has been established from underwater archaeological evidence and detailed descriptions of the harbour by the Jewish historian Josephus Flavius (Raban, 1994; Raban, in press) (Fig. 3). According to Josephus, Herod had chosen to construct the harbour and its port city Caesarea Maritima at the site of an abandoned Phoenician town called Straton’s Tower (Raban, 1988). This site was a favourable location for a transit port but posed some serious technical challenges for construction of a harbour; the coastline was relatively straight, it lacked a natural protective embayment and was subject to heavy swell and storm wave conditions during a large part of the year. Faced with these challenges, Herod enlisted the help of Roman engineers who devised an innovative plan to build a completely artificial harbour using imported materials and technology.
As summarised by Raban (in press), the harbour construction was completed in several phases; the first involved the construction of several ‘artificial islands’ on the sea bed (e.g. Areas K, U, G; Fig. 1B), by the progressive emplacement of massive concrete blocks (Raban, 1994; Brandon, 1996; Brandon, 1997) forming large concrete pads which were used as staging areas for the construction of the moles. The sea bed had first been levelled and compacted with a blanket of cobbles and boulders to prevent undermining by waves and currents (Fig. 3A). Concrete blocks of approximately 14 × 7 × 4 m were then set in place using large flat-bottomed wooden barges (‘caissons’) which were constructed onshore and towed into position (Brandon, 1996; Brandon, 1999). Once in position, the caissons were gradually settled onto the sea floor by addition of an admixture of hydraulic concrete and aggregates.

Figure 3. Method of construction of Sebastos. A. Mole foundation constructed by progressive emplacement of large concrete- filled wooden caissons on sea bed. B. Kurkar pavers and ashlars were laid over concrete foundation to form quays, which in turn supported warehouses and harbour administrative buildings. C. Present day: harbour foundation buried below thick rubble layer composed of collapsed kurkar masonry (after Reinhardt and Raban, in press).
Excavations on the northern tip of the southern mole (Area K; Fig. 1B) reveal that the caissons here were laid out side-by-side in ‘header fashion’ along a N-S line to form a continuous concrete pad 21 m in width (Raban, in press). The exposed area of the concrete pad extends 42 m southward from the northern tip of the mole but is suspected to underlie a much larger area of the mole. A second foundation wall was constructed parallel to the concrete pad using a combination of large sandstone ashlars and concrete blocks to form an inner perimeter wall which enclosed a large central cavity (Fig. 3A) (Raban, in press). The cavity space between the two foundation walls was allowed to infill with sediments, probably over the course of a few seasons through natural processes of longshore drift. Excavations on the northern mole (Area G; Fig. 1B) have uncovered a similar concrete foundation structure, indicating that it was constructed using the same technique. Other parts of the spinal walls of the mole were constructed with concrete blocks (pilae) in combination with large sandstone ashlars quarried from the local bedrock (Raban, in press). During a third and final phase, the foundation was levelled with stone rubble and its surface paved with sandstone ashlars to form a broad harbour quay (up to 50 m wide) (Fig. 3B). The quay supported an elaborate superstructure consisting of warehouses, harbour administrative buildings and a fortified sea wall that encircled the entire harbour (Fig. 3B).
When completed in 15 BC, Sebastos was the largest Roman port in the Mediterranean and became a thriving centre for the trade and transhipment of goods between the Middle East and Rome. It remained a functioning harbour until the 1st–2nd century AD when it fell into progressive disrepair; several lines of evidence suggest that a seismic event during the 1st century may have resulted in the partial destruction of the main mole (Mart and Perecman, 1996; Raban, 1999; Reinhardt and Raban, 1999) (Fig. 3C). The harbour underwent several renovations, including a major restoration c.500 AD, but its use as a major port had declined by the end of the Byzantine period. At the present day, the harbour superstructure has been lost entirely to collapse and erosion but some of the submerged substructure of the harbour remains intact (Fig. 3C). A major objective of the present study was remotely to detect and map the layout of the concrete foundations using a high-resolution magnetic survey.
Methods
Magnetic property measurements
The feasibility of detecting concrete structures with magnetic surveys was evaluated before the survey work by magnetic susceptibility testing of concrete core samples. Magnetic susceptibility (κ) is a measure of the ease with which materials obtain magnetisation and can be used to estimate the strength (amplitude) of a magnetic anomaly that will be measured during a total field magnetic survey. Analyses were also conducted on a variety of harbour-bottom sediments, pottery sherds and building stones, in order to assess the contrasts in the magnetic susceptibility of harbour bottom materials. Concrete core samples were tested from six locations on the southern breakwater (COH; Figs. 1B and 5). In each case 5 to 10 g sub-samples of the concrete were separated from the core, dried at 40°C and then disaggregated by crushing. Each sample was then weighed and its weight magnetic susceptibility (κ) was determined using a Bartington MS-2 meter (Table 1). A calibration sample was measured following each sample run to monitor and correct for instrument drift. Sediment grab samples and pottery materials were sub-sampled and measured using a similar procedure.
Marine geophysical surveys
Marine magnetic and bathymetry surveys were acquired over a 1 km2 area of the outer harbour and the inshore area seaward of the harbour (Fig. 4). An attempt was also made to survey the modern harbour but was abandoned due to high magnetic gradients at the harbour entrance. The survey was conducted from a small Zodiac inflatable boat with N-S survey lines and W-E tie lines spaced at 10–20 m intervals (total 107 line km; Fig. 4). Magnetic data were acquired using a Marine Magnetics ‘Seaspy’ Overhauser magnetometer towed at a distance of 20 m behind the boat at a depth of 1–2 m. The sensor elevation was also recorded with each magnetic measurement to allow for later correction of the waterdepth related changes in magnetic intensity. The magnetometer was cycled at 4 Hz (0.25 s sample interval), providing about one sample per metre at average boat speeds of about 4 knots. The Overhauser magnetometer has the advantage of high sensitivity (0.015 nT) and does not suffer problems with heading errors that complicate the use of optically-pumped alkali vapour magnetometers. Diurnal magnetic field variations were recorded continuously during the survey with a base station (proton) magnetometer located on the shoreline. Single-beam bathymetry data and positional data were acquired simultaneously with magnetics using a Garmin 200 KHz echosounder and Trimble differential GPS (<2 m horizontal positional error). The bathymetry data were recorded with an inline sample spacing of 0.5–1 m along the survey lines.
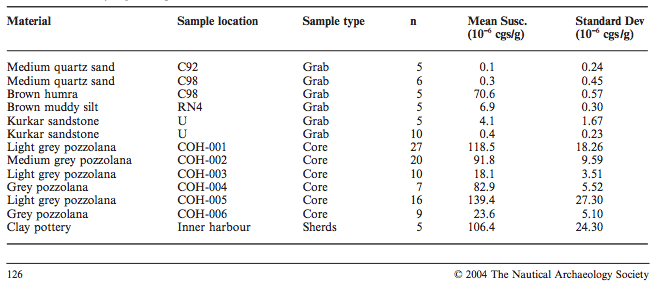
Table 1. Magnetic susceptibility data for hydraulic concrete and other tested materials. Concrete susceptibilities are one to two orders of magnitude higher than harbour bottom sediments and kurkar bedrock. Clay pottery sherds and hamra (paleosol) are also characterised by high susceptibilities
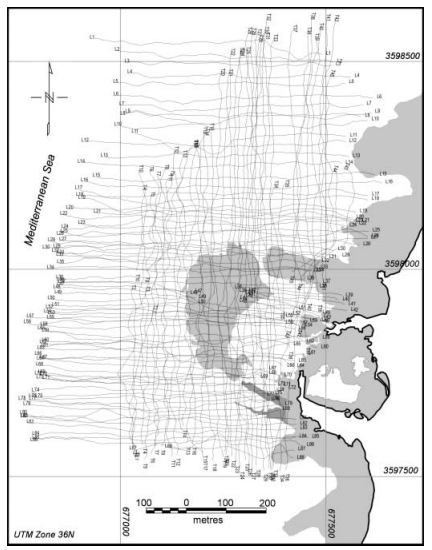
Figure 4. Magnetic survey tracklines (total 107 line km). No data were acquired within the inner harbour area due to high magnetic gradients associated with the modern harbour entranceway
The post-survey processing of magnetic data included diurnal and lag corrections, tie-line and micro-levelling (to remove uncompensated diurnal errors) and application of drape corrections (Cordell, 1985; Pilkington and Thurston, 2001). Figure 4. Magnetic survey tracklines (total 107 line km). No data were acquired within the inner harbour area due to high magnetic gradients associated with the modern harbour entranceway. NAUTICAL ARCHAEOLOGY, 33.1 128 © 2004 The Nautical Archaeology Society Drape corrections remove the effects of changes in sensor altitude and bottom topography and are critical because the magnetic signal intensity falls off rapidly with increasing water depth (by a factor of 1/r3 , where r = distance to the magnetic source body). In land-based surveys, such corrections are usually not required because the sensor(s) are carried across the ground at a constant height above the ground-surface. In a marine survey, however, both the bottom topography and the elevation of the sensor are constantly changing and need to be compensated. The 1/r3 fall-off in signal (decrease in amplitude as sensor to bottom distance increases) may, in some cases, be larger be than the amplitude of the signals of interest and may introduce a significant ‘terrain effect’ into the magnetic signal. A number of schemes have been developed for removal of terrain effects and are discussed in detail elsewhere (Pilkington and Thurston, 2001). Terrain corrections were performed in this study using the ‘chessboard technique’ of Cordell (1985).
The fully corrected magnetic data were gridded with a cell spacing of 3 m using a minimum curvature algorithm (Briggs, 1974) to generate the total field magnetic map shown in Fig. 6B. A regional residual separation of the total field data was performed by upward continuation to 50 m and subtraction of the regional field. Upward continuation is an analytical transform that yields the magnetic signal for some elevation above the original elevation at which the data were recorded (Luyendyk, 1997). Subtraction of the upward continued signal has the effect of removing long-wavelength signals associated with deep magnetic sources, thereby enhancing shorter wavelengths associated with shallow features of interest.
The processing flow for the bathymetry data involved corrections (using the GPS altimetry) for changes in sensor altitude due to waves and tidal variations, spline smoothing of profile data, and application of tie-line levelling. The corrected data were then interpolated and gridded using minimum curvature with 3 m grid cells (Fig. 6A).
Results
Magnetic property analysis
Magnetic property measurements on concrete and other bottom materials are summarised in Table 1 along with summary statistics. The hydraulic concrete samples show uniformly high magnetic susceptibilities, ranging from 1.8 × 10⁻⁵ to 1.2 × 10⁻⁴ cgs. The range of susceptibilities reflects variations in the content of ash and volcanic rock fragments (aggregate) added during the preparation of the concrete mixture. Visual inspection of core samples (Fig. 5) showed a considerable variation in the aggregate component of the concrete: it is estimated that volcanic materials (tuff and lithic fragments) make up approximately 20–40% of the concrete by volume. The aggregate materials consist mainly of basaltic and andesitic tuff fragments with varying amounts of local beach rock, shell materials and sandstone bedrock. Detailed petrographic analyses of concrete cores from Sebastos are given by Tsatskin (1999). The other harbour-bottom materials tested show low magnetic susceptibilities when compared to the hydraulic concrete (Table 1). Harbourbottom sands and muds (the most abundant materials) have low susceptibilities, ranging from 1 × 10⁻⁷ to 7 × 10⁻⁶ cgs, while the kurkar sandstone bedrock has an average susceptibility of 4 × 10⁻⁶ cgs. The contrast in susceptibility between concrete and harbour bottom sediments is substantial (up to 2 orders of magnitude) and results in a strong magnetic anomaly that can be measured with a total field magnetic survey (see below).
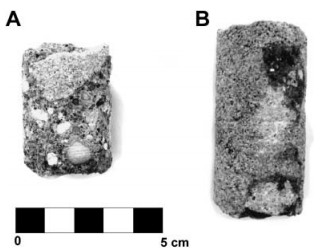
Figure 5. Examples of concrete core samples. A. Dark grey pozzolana with abundant tuff fragments. B. Light grey pozzolana showing lower abundance of aggregate materials.
Hamra sediments and pottery fragments are characterised by magnetic susceptibilities that are intermediate between the concrete and harbour bottom sediments (Table 1). Some hamra samples show high susceptibility values (>7 × 10⁻⁵ cgs) owing to high concentrations of iron oxides within the paleosol layers. The relatively high susceptibility of the hamra materials indicates that they may produce a measurable magnetic anomaly if they are present in sufficient thickness within the kurkar bedrock.
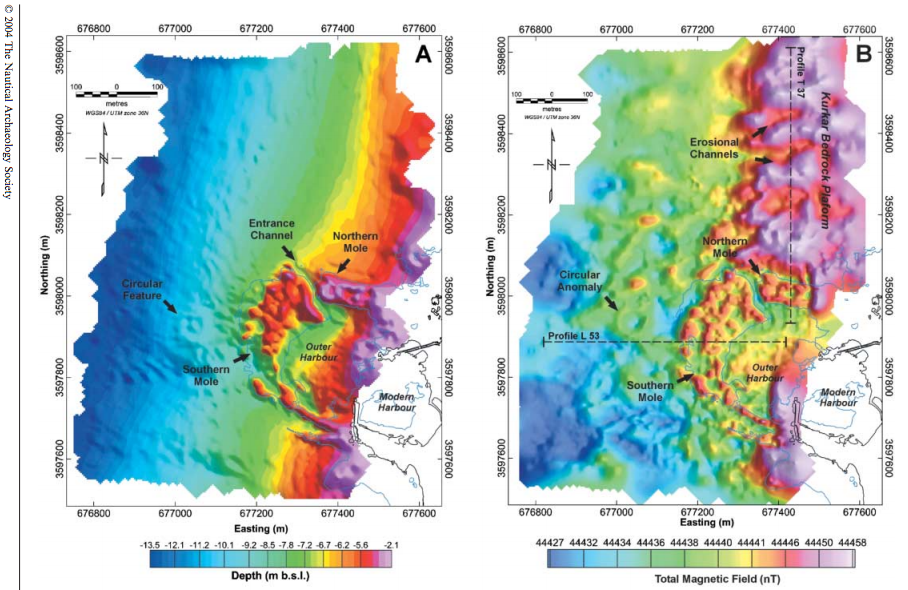
Figure 6. A. Shaded relief bathymetry map of harbour and inshore area. Note irregular surface relief over southern mole due to collapsed rubble. B. Total field magnetic map showing increased magnetic intensity (3–10 nT) and rectilinear pattern of magnetic lineaments over harbour moles. Broad N-S zone of high magnetic intensity is associated with kurkar bedrock platform (see Fig. 1B).
Bathymetry
The results of the bathymetry survey are shown in a colour-shaded map in Figure 6A. The water depth across the harbour area varies from about 2 m to more than 8 m. The northern and southern moles and the harbour entrance channel are clearly visible in the bathymetric data and correspond approximately with the outline of the moles estimated from air-photos (Fig. 6A). The northern mole has a well-defined rectangular outline and an apparently ‘compartmentalised’ internal structure defined by linear rubble mounds on its surface. The southern mole has a much more irregular surface topography and shows no apparent internal structure in the bathymetry. The irregular topography reflects the more advanced state of collapse of the southern mole when compared to the northern mole, which lies in a position that is sheltered from wave attack. Seaward of the harbour, the bathymetry shows a smooth, gently sloping shelf. This is relatively featureless other than a minor erosional channel lying to the south-west of the Herodian harbour, and an anomalous low-relief circular mound 150 m west of the southern mole (Fig. 6A). The mound is approximately 100 m in diameter and has a relief of about 0.5–1 m. The feature has magnetic expression as a well-defined circular anomaly (c. 3–4 nT) on the total field map (Fig. 6B) and is made up chiefly of ballast stones and abundant pottery fragments (Boyce et al., in press).
Marine magnetic survey
The results of the magnetic survey work are discussed with reference to the total field map (Fig. 6B), magnetic profiles (Fig. 7), and the residual magnetic field map in Fig. 8. The total magnetic field map (Fig. 6B) displays a relatively rugged magnetic topography across the study area, with a total field variation of about 30 nT. The variation in magnetic intensity is related to changes in the magnetic oxide content (principally magnetite) of the bottom materials and underlying bedrock. Localised zones of increased magnetic intensity (magnetic anomalies; ‘hot colours’) indicate the presence of materials with elevated levels of magnetite and increased magnetic susceptibility. The most prominent magnetic feature on the map is a broad N-S trending zone of high magnetic intensity (>44,450 nT) on the eastern margin of the study area (Fig. 6B). The zone corresponds with a broad bedrock platform that forms the modern shoreline and underlies the present-day harbour (Fig. 1B). The drop in intensity at the edge of the bedrock platform is marked (>10 nT; Fig. 7) and indicates either a change in the magnetisation of the bedrock, or an increase in the depth to the bedrock surface as a result of erosion or possibly bedrock faulting (Mart and Perecman, 1996). The bedrock platform shows a rugged magnetic relief of steeply incised bedrock channels and intervening ridges (Fig. 7A), most likely eroded during a phase of lowered sea levels (Avnimelech, 1962).
The harbour moles are identified on the total field map by a complex pattern of linear magnetic anomalies (Fig. 6B). The northern mole shows a distinctive ‘framework pattern’ of W-E and N-S trending magnetic highs that closely resembles its relief pattern in the bathymetry map (Fig. 6A). The anomaly pattern in the southern mole is more complex, but also clearly shows some rectilinear elements. It is also of note that the overall magnetic intensity across the outer harbour is lower than that on the adjacent kurkar bedrock platform to the north and south of the harbour. This apparently indicates an increase in the depth to bedrock below the outer harbour. Other interesting magnetic anomalies on the total field map include a distinctive circular anomaly and other linear anomalies in the area seaward of the Herodian breakwater. The circular anomaly corresponds with a subtle mound in the bathymetry (Fig. 6A) and indicates a possible buried feature(s) at shallow depth. Sediment probes conducted across the feature located concentrations of building stone, pottery and ship ballast materials. The origin of the structure and its relation to the Herodian harbour are still under investigation but preliminary works suggests that it is the location of a Byzantine period mooring site (Boyce et al., in press).
The structure of the Herodian moles is more clearly defined in the residual magnetic map (Fig. 8A). This map emphasises the contributions from near-surface magnetic sources and is produced by subtraction of long-wavelength (deep) signal components from the total field map (Milligan and Gunn, 1997). This processing step enhances the edges of magnetic boundaries and aids interpretation of the anomaly patterns (Fig. 8B). The northern mole shows a rectangular pattern of N-S and W-E linear magnetic anomalies that define a ‘box-like’ structure about 150 m in length and 60 m in width. The structure is sub-divided into three roughly equidimensional compartments or ‘cells’ that have lower magnetic intensities (Fig. 8B). In profile, the cellular structure of the mole is also evident in the distinctive ‘double-peaked’ anomaly pattern (Fig. 7A), which indicates two separate buried masses separated by a zone of lower magnetic intensity.
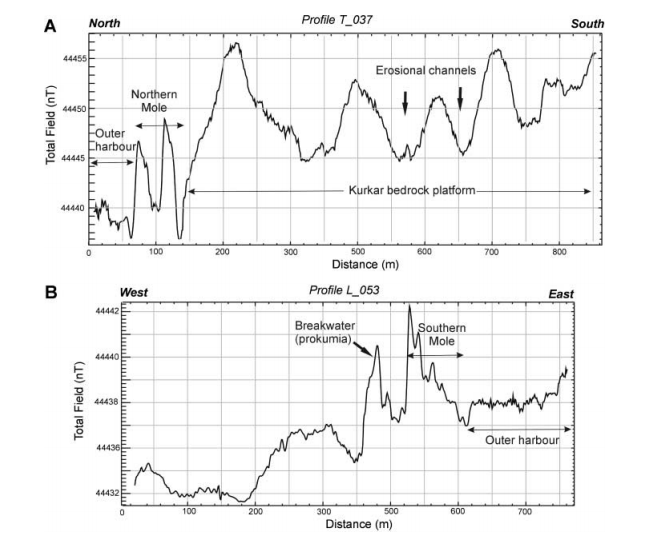
Figure 7. A. N-S profile showing magnetic topography across kurkar bedrock platform and northern mole. Mole is marked by double-peaked anomaly and local 8–10 nT increase magnetic intensity. B. W-E magnetic profile showing well-defined magnetic anomalies over southern mole. Location of profiles shown in Fig. 6B.
The localised increase in intensity over the mole is about 3–10 nT and is consistent with the presence of high magnetic susceptibility material (i.e. hydraulic concrete) within the mole structure. The other harbour building materials (kurkar sandstone) and bottom sediments have susceptibilities that are too low to account for the observed anomaly (see Modelling below). Comparison of the mapped locations of concrete foundations, at Areas K and G for example (Fig. 1B), with the residual magnetic map (Fig. 8A) confirms that concrete materials are associated with increased magnetic intensities. At Area K, the N-S oriented concrete pad exposed at the northern end of the mole stands out as a well-defined rectangular magnetic high on the residual magnetic map. Similarly, at Area G on the northern mole, the partially exposed concrete foundation can be recognised as a north-west-oriented magnetic lineament (Fig. 8A).

Figure 8. A. Residual magnetic field map of harbour. Note distinct rectilinear pattern of positive magnetic anomalies separated by magnetic lows. B. Interpretation of magnetic lineaments. Linear positive magnetic anomalies are interpreted as framework of concrete foundation blocks enclosing baffles infilled with lower magnetic susceptibility sediments.
The buried structure of the southern mole seems to be less well organised (Figs. 7B, 8A), probably in part due to its more advanced state of collapse. Using the northern mole as a guide, it is possible, however, to discern a pattern of linear architectural elements within the southern mole (Fig. 8B). The most prominent feature is a north-south oriented rectangular structure with similar dimensions (60 m wide and 180 m long) to the northern mole (Fig. 8B). The internal organisation of the feature is unclear, but seems to have several internal compartments or cells. The rectangular feature is continuous to the south with a crudely arcuate magnetic anomaly that corresponds with the arched inner wall of the southern mole. The procumatia or breakwater barrier is also evident in the magnetic residual map as a broad arc of positive magnetic highs lying seaward of the main rectangular framework (Fig. 8A). Other prominent magnetic features on the southern mole include magnetic highs at Area U (Fig. 1B; location of known concrete platform) and a well-defined linear structure defining the western edge of the harbour entrance channel.
Magnetic source modelling
The increase in magnetic intensity over the harbour moles (c. 3–10 nT) indicates the presence of a large volume of high magnetic susceptibility material within the buried harbour structure. The susceptibility measurements of harbour construction materials and bottom sediments (Table 1) strongly suggest that hydraulic concrete is the magnetic source. This interpretation is further verified by magnetic modelling of the source body shape and depth (Boyce et al., 2003). Detailed discussion of magnetic modelling is beyond the present scope, but in brief, it is possible to estimate the depth and geometry of a magnetic source body (i.e. the buried structure) from its anomaly amplitude and shape using one of several of analytical techniques (Talwani and Heirtzler, 1964; Won and Bevis, 1987). Boyce et al. (2003) estimated the dimensions of concrete blocks and their depth of burial using the susceptibility data (Table 1) obtained in this study. The results, summarised in Fig. 9, show that the observed ‘double-peak’ magnetic anomaly of the northern mole can be reproduced when concrete blocks (κ = 1 × 10⁻⁴ cgs) 14 m width by 4 m in height are placed at shallow depth within a low magnetic susceptibility substrate (κ = 1 × 10⁻⁶ cgs). The width of the void space between the concrete caissons is estimated at 24–26 m based on the forward model results. The increased amplitude of the magnetic anomaly on the north edge of the mole (Fig. 9A) indicates that the concrete foundation along that side is at a higher elevation than the south side, or conversely that the concrete wall is thicker here.
The modelling results also show that the kurkar bedrock making up the platform to the north of the mole has a higher bulk magnetic susceptibility (>5 × 10⁻⁴ cgs) than indicated by the core measurements (Table 1). The increased susceptibility of the bedrock here may indicate the presence of thick hamra (paleosol) layers within the kurkar, and would explain the relatively high magnetic intensity measured across the bedrock platform (Fig. 6B). The linear pattern of magnetic anomalies over the northern and southern mole structures (Fig. 8) however, rules out the possibility that they are simply the result of changes in bedrock elevation or bedrock magnetic susceptibility (Boyce et al., 2003).
Interpretation and discussion
The pattern of magnetic lineaments over the outer harbour indicates that both the northern and southern moles are underlain by an extensive hydraulic concrete foundation. Further insights into the method of construction of the foundation and its possible layout can be obtained by comparing the model results with archaeological evidence from the site (i.e. Fig. 10A). The dimensions of the concrete foundation walls estimated from the magnetic model (Fig. 9) indicate a crosssectional width of about 14–15 m and height of 4–5 m. These dimensions are comparable to the length and height of concrete caissons exposed at Areas K and G (Fig. 1B). The caissons at Area K were laid out in header fashion (side-by-side) along a N-S line to form a working platform (Fig. 10A). The header arrangement is typical of the Levanto-Phoenician building tradition and produces a foundation with good lateral stability and resistance to foundering. It can be assumed that Herod’s engineers would have used this method of construction for the remainder of the foundation works.
Figure 10B shows a conceptual model for the northern mole based on the observed header pattern at Area K and the geophysical survey data presented in this paper. In this reconstruction, a 14 m wide foundation wall is constructed around the perimeter of the mole by the successive placement of caissons in a header pattern. The northwest tip of the northern mole could have been constructed in a similar fashion, but with the foundation wall oriented at about 45° towards the north-west. As the concrete foundation was laid, coarse rubble and boulders were placed on the sea floor and along the outside perimeter of the wall to shore up the concrete blocks and prevent undermining by waves (Reinhardt and Raban, in press). The magnetic anomaly pattern (Fig. 8A) also suggests that the internal compartment walls within the northern mole would have been constructed by the placement of concrete headers along three N-S lines at approximately 30 m apart (Fig. 10B). The void cells within the foundation structure have estimated dimensions of about 20 m by 30 m. During a second phase of construction, the cells would have been infilled with beach sand to stabilise the mole structure. Infilling may have been carried out actively, by dredging and dumping of sediment into the cells, or passively, through the natural process of long shore drift along the coast (Reinhardt and Raban, in press).
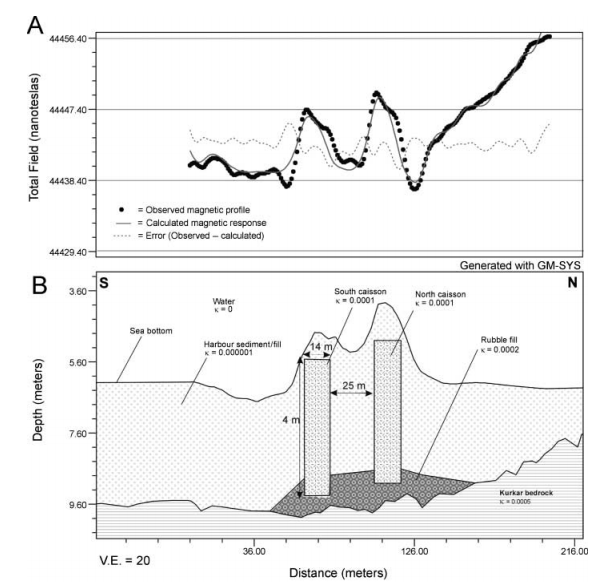
Figure 9. Results of magnetic forward modelling of northern mole (after Boyce et al., 2003). A. Observed and calculated magnetic profiles for southern portion of N-S line T037 (location in Fig. 6B). Error curve shows difference between observed and calculated magnetic response. B. Magnetic model cross-section showing modelled stratigraphy and concrete blocks (14 m wide × 4 m height, κ = 1×10⁻⁴ cgs) buried within low magnetic susceptibility sediment (note: vertical exaggeration is 20 times).
The internal structure of the southern mole is more difficult to decipher, because it is in a more advanced state of collapse and has a less welldefined magnetic pattern (Fig. 8A). The interpreted anomaly patterns however, do show a roughly rectangular structure within the main part of the mole with dimensions of about 60 m wide and 180 m long (Fig. 8B). These dimensions are strikingly similar to the northern mole and perhaps suggest that construction of the southern mole may have begun with emplacement of a rectangular foundation work similar to the one shown in the conceptual model (Fig. 10B). The foundation would have provided a large working platform for the construction of the southern mole. The sequence in which the foundation walls were emplaced can only be speculated, but it would seem logical that the northern mole would have been constructed first and built progressively westward from shallow to deeper water beginning at the bedrock promontory at its eastern end. Once completed, the northern mole would have provided a staging area for construction of the second artificial islet that would eventually form the ‘core’ of the southern mole (Fig. 8B). Once in place, the two islets would have created a large sheltered embayment in which ships and settling barges could be navigated safely. The progressive southward expansion of the southern mole and erection of the harbour superstructure would have then followed in later phases (Raban, in press).

Figure 10. A. Plan layout of concrete caissons excavated at Area K (location shown in Fig. 1B). B. Conceptual model for layout of concrete caissons below northern mole based on magnetic survey and results of forward modelling.
The broader significance of the magnetic survey results, from an archaeological standpoint, is that they confirm the extent to which imported materials and technology were used in the construction of Sebastos. Using the volume of the Area K caissons (c.390 m3 ) and the interpreted magnetic anomaly map (Fig. 8B), it is possible to derive an estimate of the total volume of concrete used in the construction of the harbour. Assuming a header construction method (i.e. Fig. 10B) it is estimated that the northern mole would have required more than 2.8 × 10⁴ m3 or about 57,000 metric tonnes of hydraulic concrete to construct. The figure for the southern mole would have been considerably higher, at least 5 × 10⁴ m3 or about 120,000 tonnes. The total quantity of concrete used during the project was thus considerable (about 180,000 tonnes) and makes the harbour truly unique from an engineering standpoint. Considering that the average merchantman of the time had a hold capacity of about 200 tonnes, the shipment of the materials (i.e. pozzolana, lime and timber) from Italy would have been an enormous and costly undertaking, and would have required several years to complete.
Summary
This study demonstrates the utility of magnetic methods for mapping buried concrete structures in a marine archaeological setting and provides important new insights into the method of construction of Herod’s harbour. Magnetic property testing of hydraulic concrete samples shows that they are characterised by high magnetic susceptibilities and are good targets for magnetic detection. It is anticipated that the methods described here will have wider application to other Roman harbour sites where pozzolan concrete materials were employed.
Magnetic mapping at Sebastos confirms that concrete structures exposed at several locations on the harbour are part of a much more extensive foundation work that underlies the entire mole structure (Fig. 8B). The interpreted magnetic anomaly patterns suggest that the two moles were established by the construction of two large rectangular ‘islets’ with concrete perimeter walls and internal compartments or ‘cells’. The compartments were either actively infilled, or acted as large baffles trapping littoral sediment through the natural processes of longshore drift.
Acknowledgements
This work was supported through Natural Science and Engineering Research Council of Canada research grants to Boyce and Reinhardt. The authors thank students of the Combined Caesarea Expedition (S. Collins, B. Goodman) for field assistance and the staff of the Recanati Institute (S. Breitstein, A. Yurman) for technical support and assistance with survey operations.
References
Avnimelech, M. A., 1962, The main trends in the Pleistocene-Holocene history of the Israeli coastal plain, Quaternaria 6: 479.
Boyce, J. I., Reinhardt, E. G., Raban, A., and Pozza, M. R., 2003, Magnetic imaging of a submerged Roman harbour, Caesarea Maritima, Israel, Geophysical Research Abstracts 5: 73.
Boyce, J. I., Reinhardt, E. G., and Raban, A., in press, Magnetic detection of buried harbour structures and mooring sites in King Herod’s harbour, Caesarea Maritima, Israel. In Proceedings, Underwater Detection in Archaeology. May 3–7th, Bodrum, Turkey
Brandon, C., 1996, Cements, concrete, and settling barges at Sebastos: comparisons with other Roman harbour examples and the descriptions of Vitruvius, in A. Raban, K. G. Holum, and E. J. Brill (eds), Caesarea Maritima: A Retrospective After Two Millennia. 25–40. New York.
Brandon, C., 1997, The concrete-filled barges of King Herod’s harbour of Sebastos, in S. Swiney, R. Hohlfelder, and H. Swiny (eds), Cyprus and the Eastern Mediterranean from Prehistory to Late Antiquity. Res. Maritimae, 45–58. Atlanta.
Brandon, C., 1999, Pozzolana, lime, and single-mission barges (Area K), in K. Holum, A. Raban, and J. Patrich (eds), Caesarea Papers, 2. Journal of Roman Archaeology, Supplementary Series, 35: 169–78
Briggs, I. C., 1974, Machine contouring using minimum curvature. Geophysics, 39: 39–48.
Cordell, L. E., 1985, Techniques, applications, and problems of analytical continuation of New Mexico aeromagnetic data between arbitrary surfaces of very high relief, in Proceedings of the International Meeting on Potential Fields in Rugged Topography, Institute of Geophysics, University of Lausanne, Switzerland, Bulletin no. 7: 96–9.
Hillard, T. W., 1989, A Hellenistic quay in Caesarea’s north bay, Mediterranean Archaeology 2: 143–6
Hohlfelder, R. L., 1988, Procopius, De Aedificiis 1.11.18–20: Caesarea Maritima and the Building of Harbours in Late Antiquity, Mediterranean Historical Review 3: 54–62.
Hohlfelder, R. L., 1997, Building harbours in the Early Byzantine Era: the persistence of Roman technology, Byzantinische Forschungen 24: 367–80.
Hohlfelder, R. L., 1999, Building Sebastos: the Cyprus Connection, IJNA 28: 154–63.
Luyendyk, A. P. J., 1997, Processing of airborne magnetic data, AGSO Journal of Australian Geology and Geophysics 17: 31–8.
Mart, Y. and Perecman, I., 1996, Neotectonic activity in Caesarea, the Mediterranean coast of central Israel, Tectonophysics 254: 139–53.
Milligan, P. R. and Gunn, P. J., 1997, Enhancement and presentation of airborne geophysical data, AGSO Journal of Australian Geology and Geophysics 17: 63–75.
Oleson, J. P., 1988, The technology of Roman harbours, IJNA 17: 117–29.
Pilkington, M. and Thurston, J. B., 2001, Draping corrections for aeromagnetic data: line- versus grid-based approaches, Exploration Geophysics 32: 95–101.
Raban, A., 1988, In search of Straton’s Tower: some additional thoughts, in R. Vann (ed.), Caesarea Papers, 23–35. Ann Arbor
Raban, A., 1992, Sebastos, the royal harbour at Caesarea Maritima—a short-lived giant, IJNA 21: 111–24
Raban, A., 1994, Sebastos, the Herodian harbour of Caesarea: construction and operation, Sefunim 8: 45–59
Raban, A., 1999, Lead ingots from Wreck Site (K8), in K. G. Holum, A. Raban, and J. Patrich (eds), Caesarea Papers 2, 179–88, Journal of Roman Archaeology, Supplementary Series, 35, Ann Arbor.
Raban, A., in press, Sebastos—the royal harbour of Herod the Great, in N. Kokkinos (ed.), Building Projects of Herod the Great. London.
Reinhardt, E. G. and Raban, A., 1999, Destruction of Herod the Great’s harbour at Caesarea Maritima, Israel—geoarchaeological evidence, Geology 27: 811–14.
Reinhardt, E. G. and Raban, A. in press, Site formation and stratigraphic development of the ancient harbour at Caesarea Maritima, Israel, in K. G. Holum and A. Raban (eds), Caesarea Papers 3. Journal of Roman Archaeology, Supplementary Series, Ann Arbor.
Talwani, M. and Heirtzler, J. R., 1964, Computation of magnetic anomalies caused by two-dimensional structures of arbitrary shape, in G. Parks (ed.), Computers in the Mineral Industries, 464–80. Standford.
Tsatskin, A., 1999, The petrography of hydraulic and other building materials in Caesarea, in K. G. Holum, A. Raban, and J. Patrich (eds), Caesarea Papers 2, 419–29. Journal of Roman Archaeology, Supplementary Series 35, Ann Arbor.
Won, I. J. and Bevis, M. G., 1987, Computing the gravitational and magnetic anomalies due to a polygon: algorithms and Fortran subroutines, Geophysics 52: 232–8.